Monitoring Software
Accessibility Monitoring Dashboard
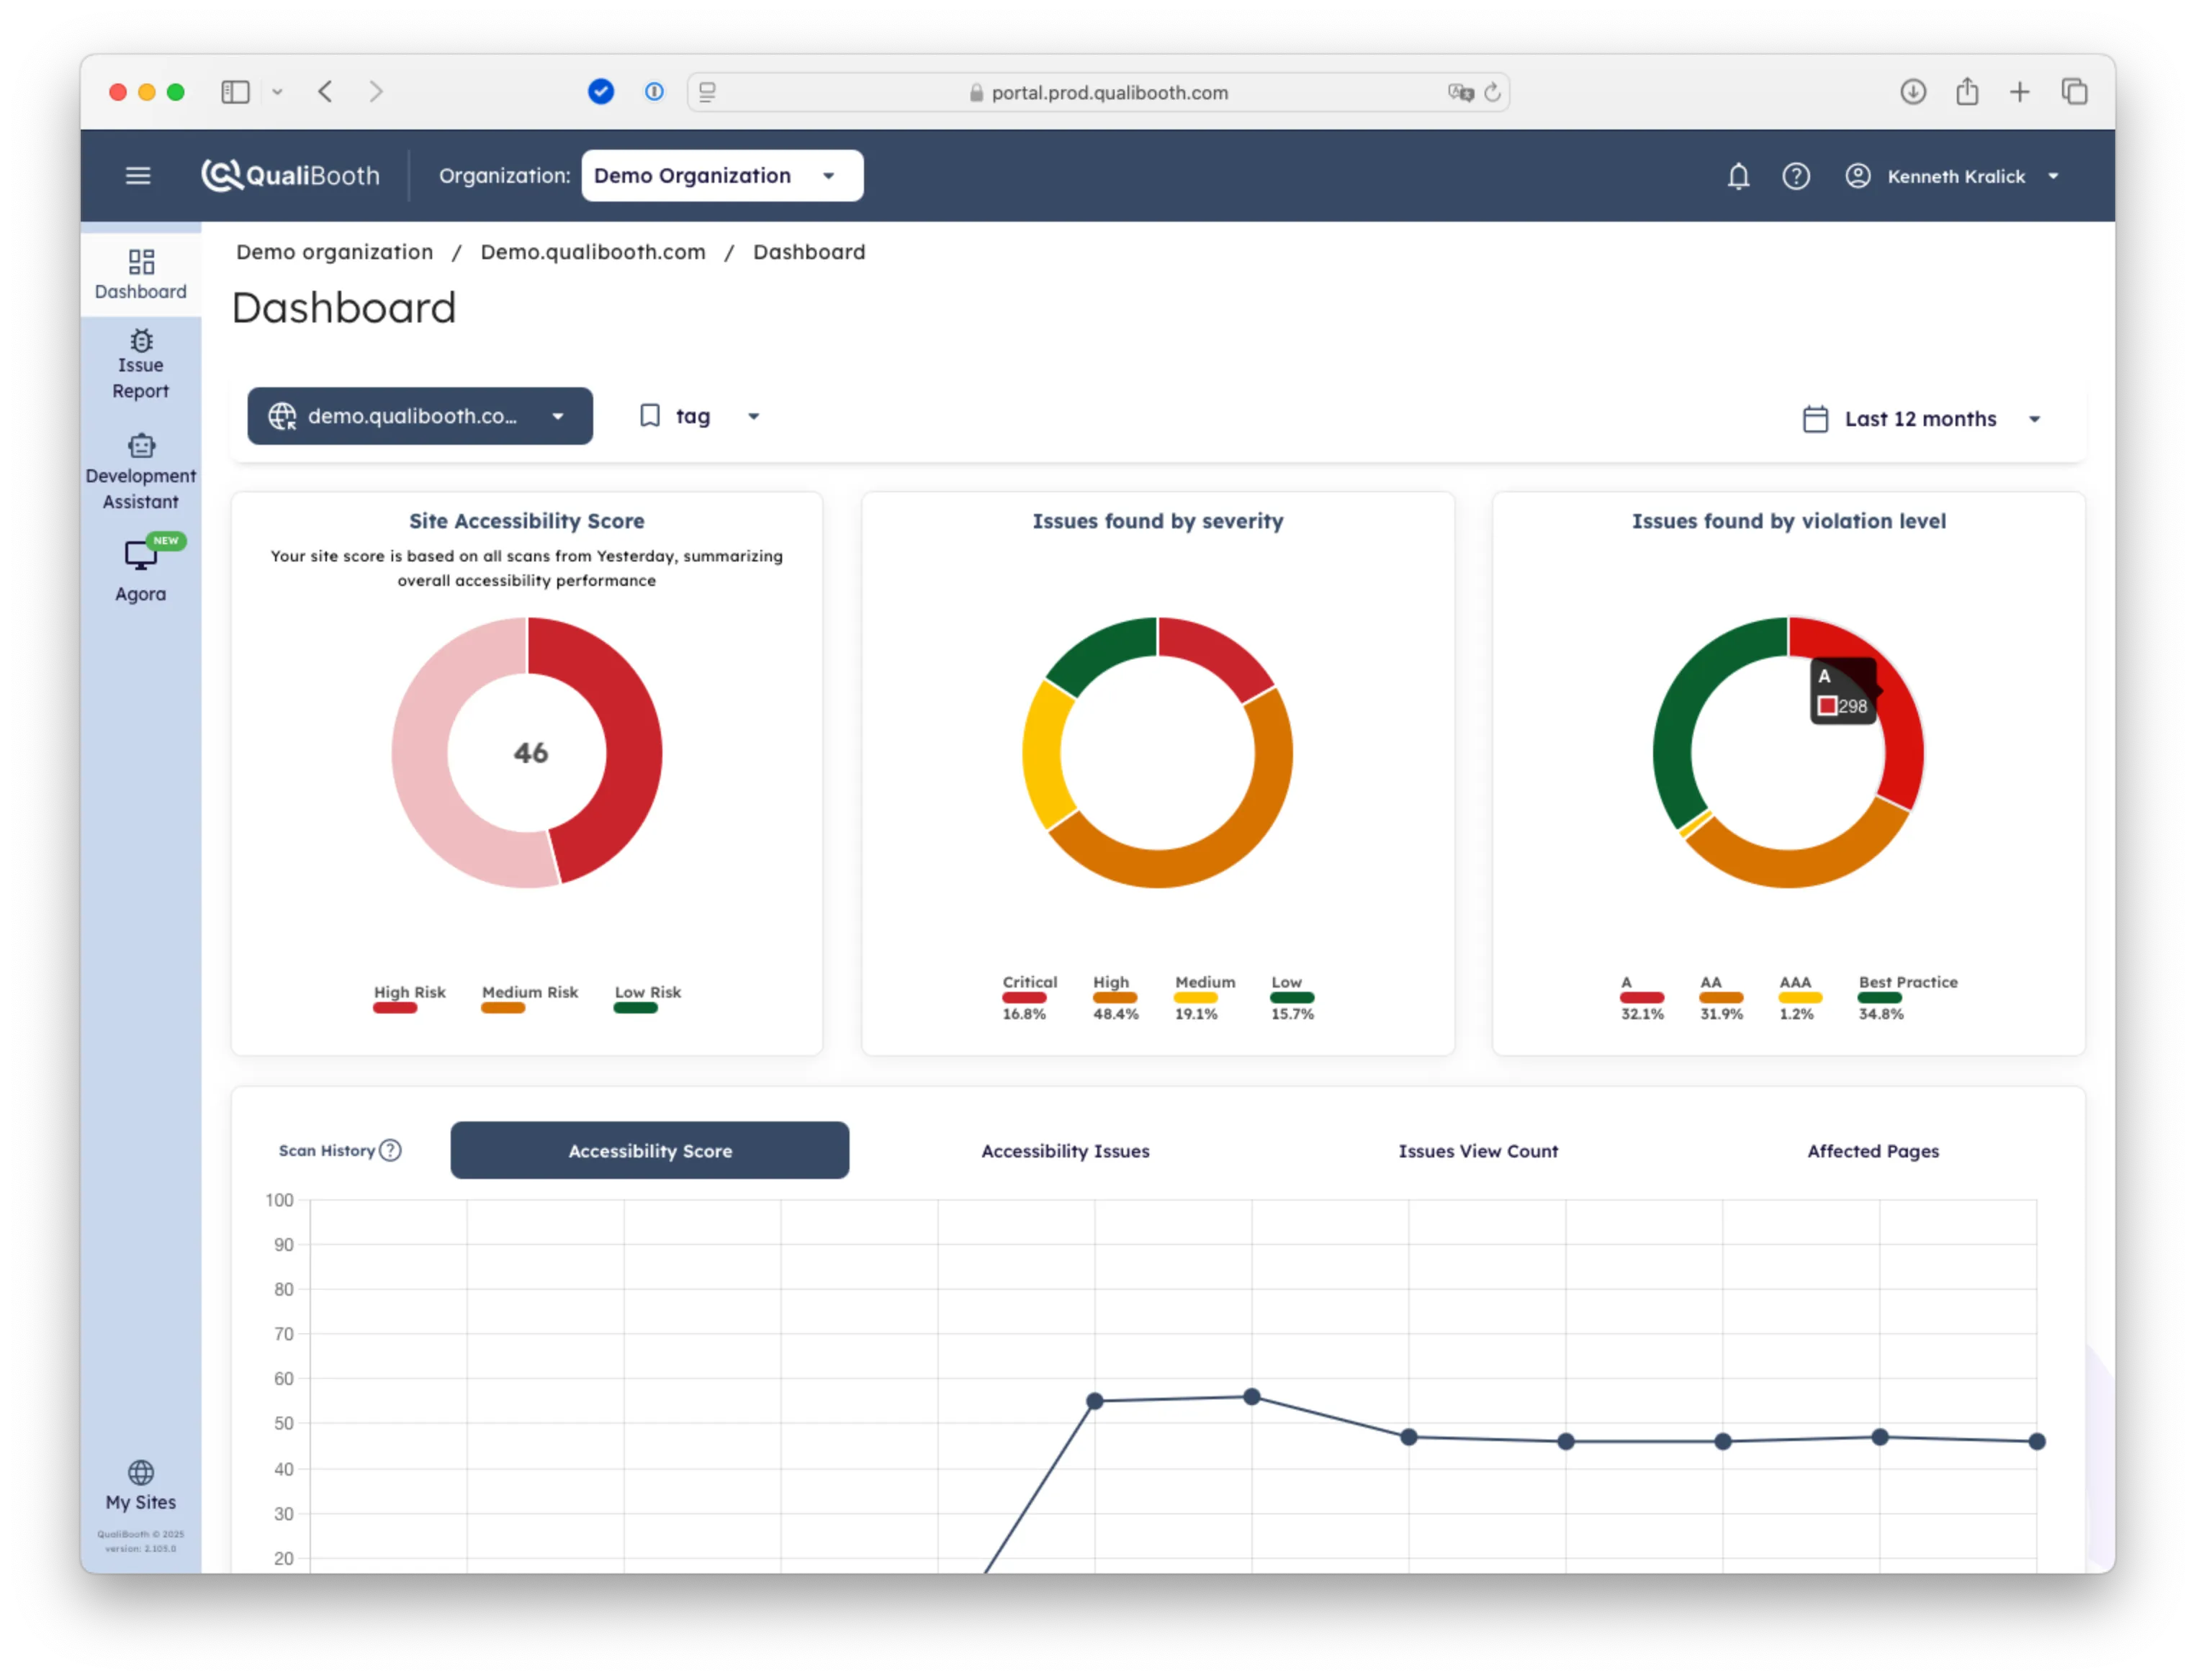
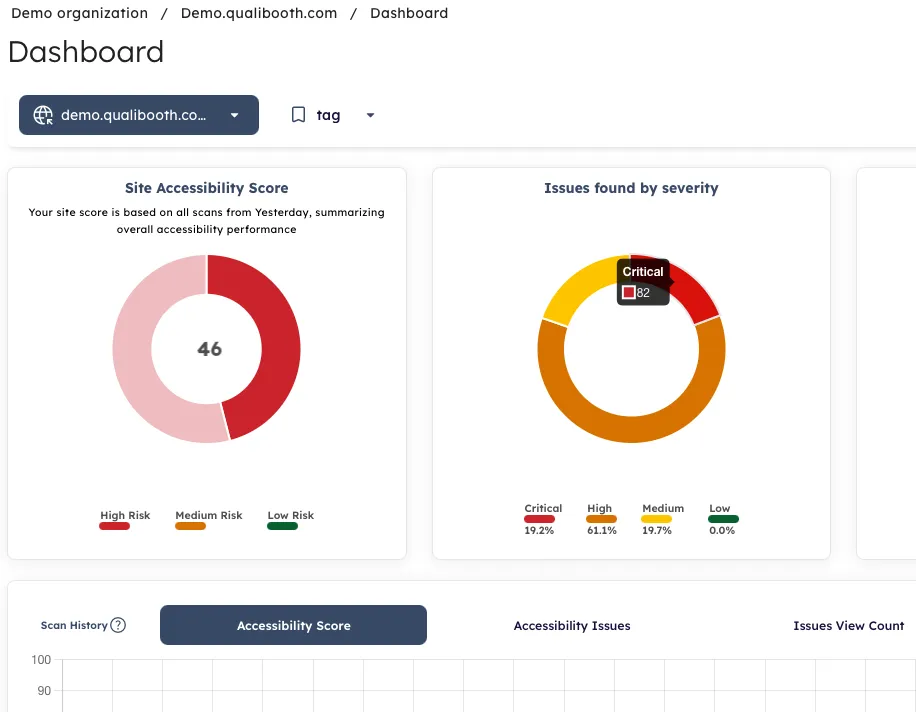
The site dashboard is the focal point of your accessibility scores
What is on the Dashboard?
The Monitoring Dashboard provides a comprehensive and dynamic view of your website's accessibility. This enables targeted, effective, and continuous improvement and compliance with accessibility standards. Using data analytics and filtering options, you can easily navigate all aspects of your website's progress.
The Dashboard begins to aggregate and display data within the first day of installation. Then the information will update hourly, enriching your overview with the latest information.
What you'll learn
Visualize your website's accessibility journey through various views, detailing changes over time. Whether you're interested in data from the past hour or past year, these charts enable focused reviews and strategic planning through four different perspectives:
- Accessibility Score Chart
- Accessibility Issues
- Issue's View Count
- Pages Affected
Important information available at a glance
Use the charts to identify trends, understand the scope of issues, illustrate the real-world impact on customers, and determine legal risk.
Issues by Severity
Displays issues found during the selected period based on severity (Critical, High, Medium, Low) which is measured by combining the impact on usability and how often a customer would encounter the problem.
Issues by Violation Level
Displays issues found during the selected period based on violation levels graded by the WCAG (A, AA, AAA). While addressing A and AA levels is generally considered the baseline for legal compliance in most markets, achieving AAA makes your website fully accessible and considers possible future regulation requirements.